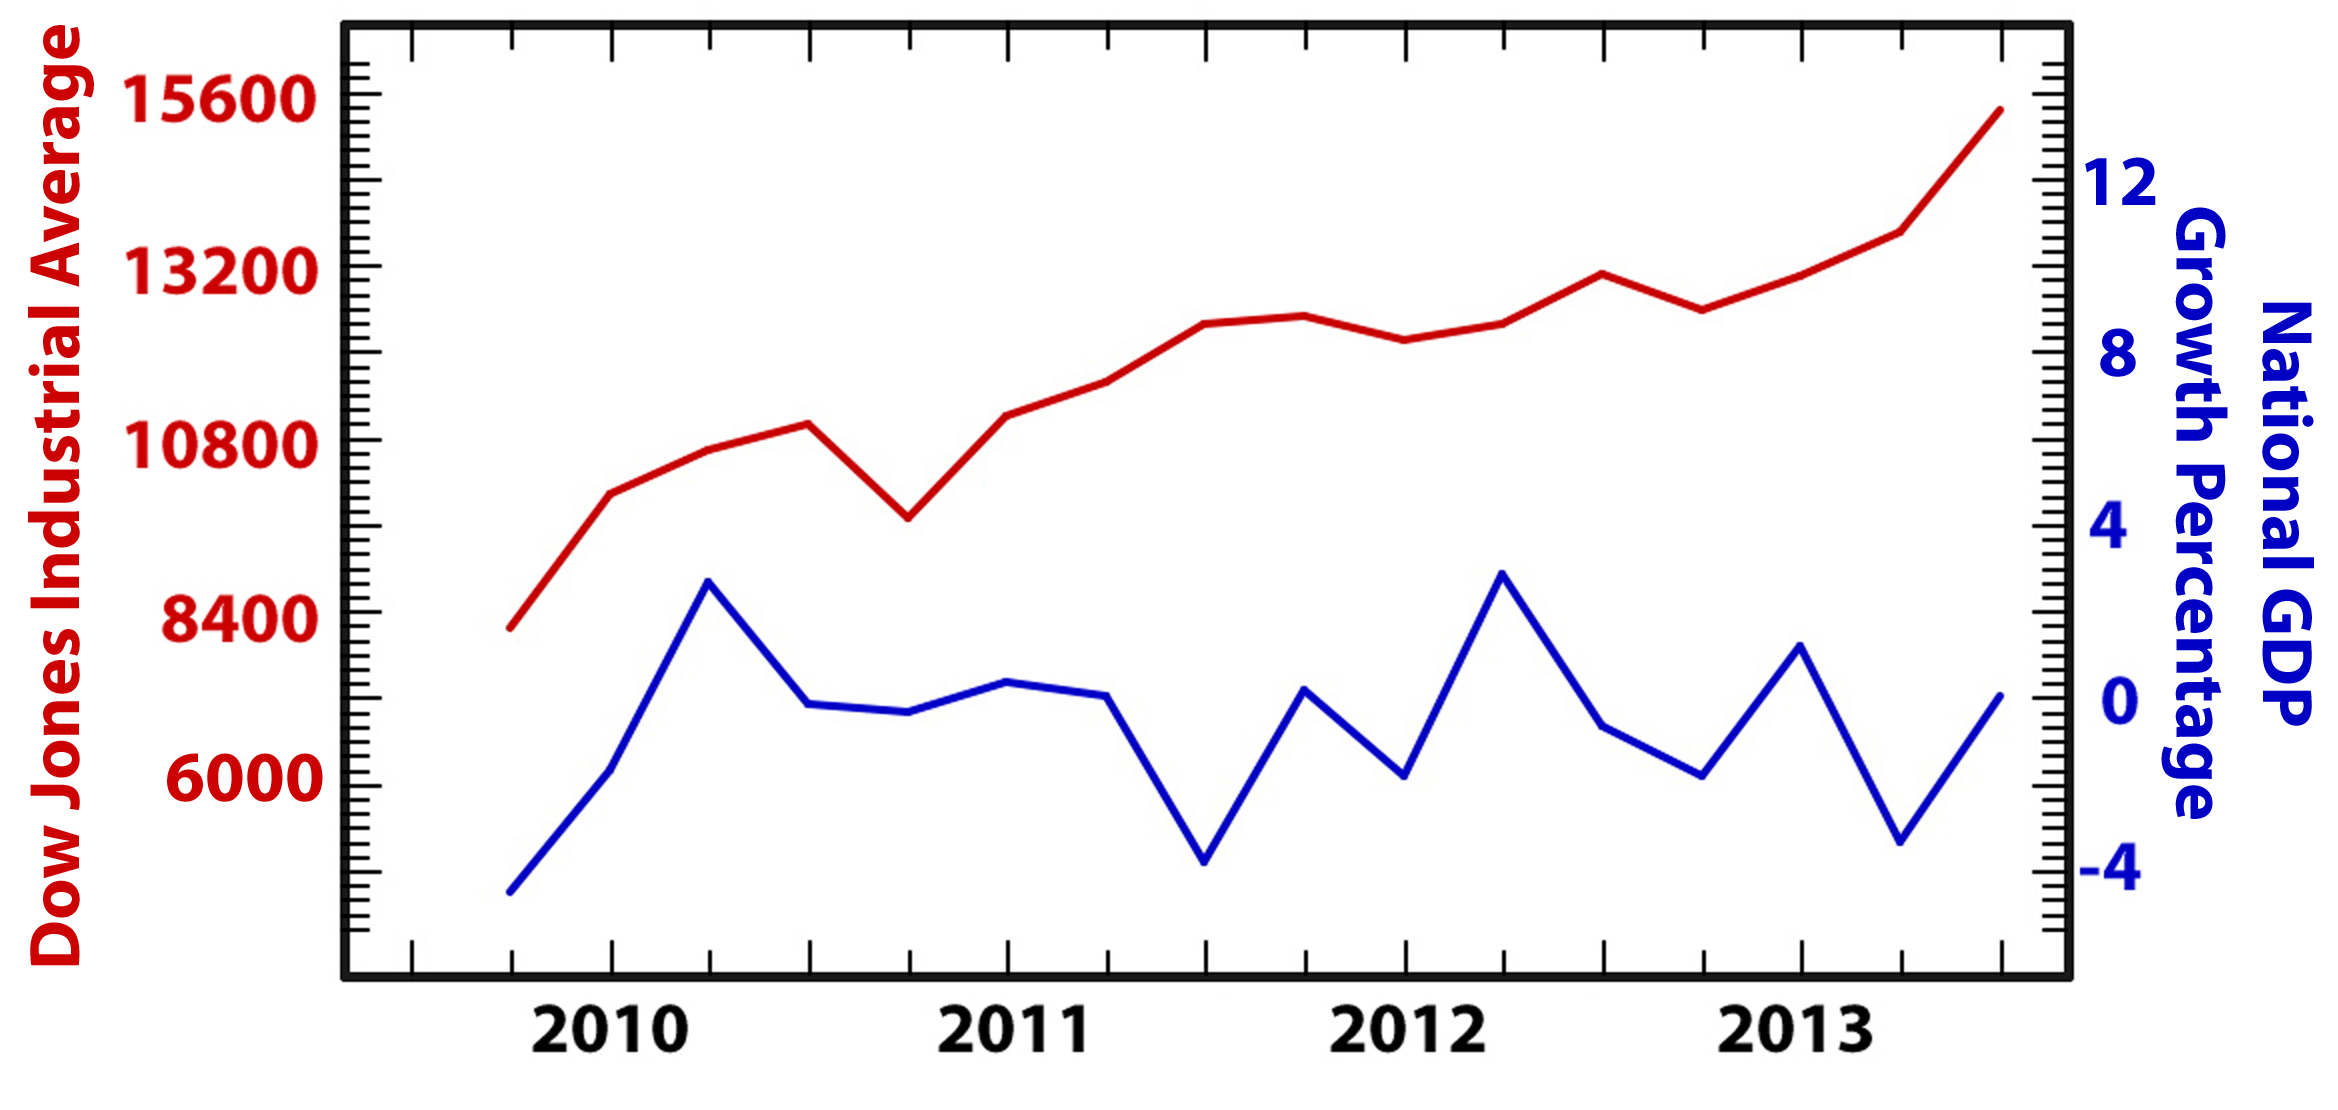
Figure 1. Market performance and economic growth versus time, as gauged by the DJIA and National GDP growth percentage.
The combination of low interest rates and quantitative easing has resulted in a significant run up in the equity markets, not necessarily supported by the growth in the gross domestic product (Figure 1). As a result of improved market performance, the Federal Reserve began so-called ‘hawkish’ discussion of increasing the Federal funds rate and potentially scaling back QE. This resulted in a pullback in specific sectors of the equity market and nearly every facet of the fixed-income market over the past 6 weeks. The bond markets, in particular, have exhibited the largest volatility since 2008, due to interest rate risk. Interest rate risk is the term used to describe the correlation between bond prices and interest rates. When bonds are issued with a specific yield, and then rates subsequently rise, the value of those bonds will decrease. This interest rate risk has been the dominant factor in determining bond prices year-to-date. The ten-year treasury yields have increased over 35% from 1.63% to 2.3%, as seen in Figure 2.
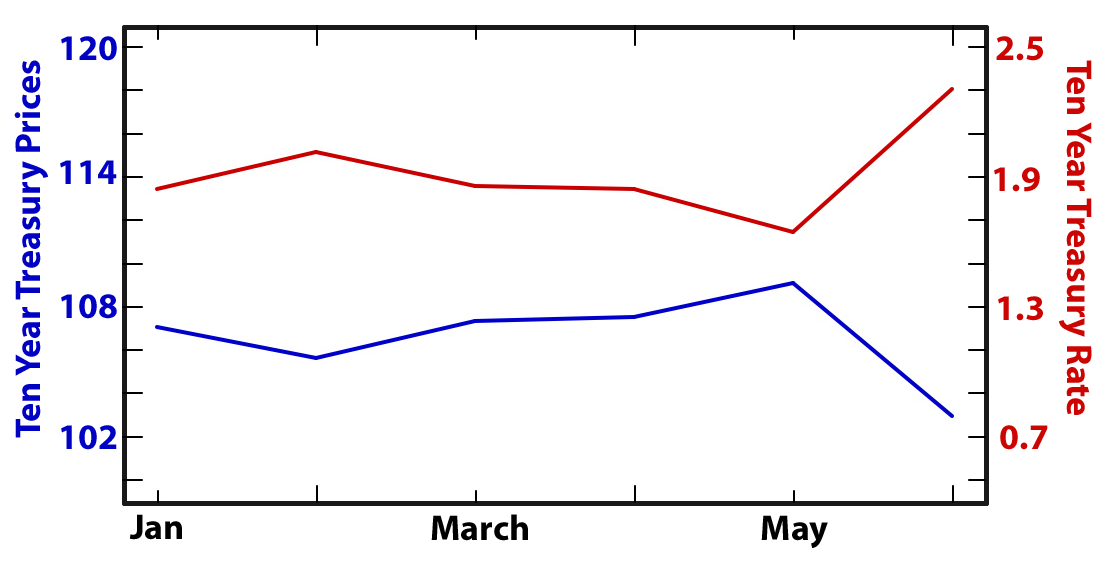
Figure 2. Correlation of bond prices to interest rates for year to date 2013. Interest rates and bond prices were relatively stable until May 2013.
Recent Comments